Australian property and the S&P 500 (in AUD) represent two of the most popular investment options for wealth creation. This article compares their performance over the past five decades (1975–2024), analyzing returns, risks, and key drivers like interest rates, migration, and wage growth. Whether you're an investor, homeowner, or policy enthusiast, understanding these trends can inform better financial decisions. We’ll explore:
- Annual return trends and volatility
- Impact of interest rates and migration on property prices
- Divergence between wage and housing price growth
- Risk-reward trade-offs between Australian property and the S&P 500
1. Housing Price Growth vs Wage Growth (1975–2025)
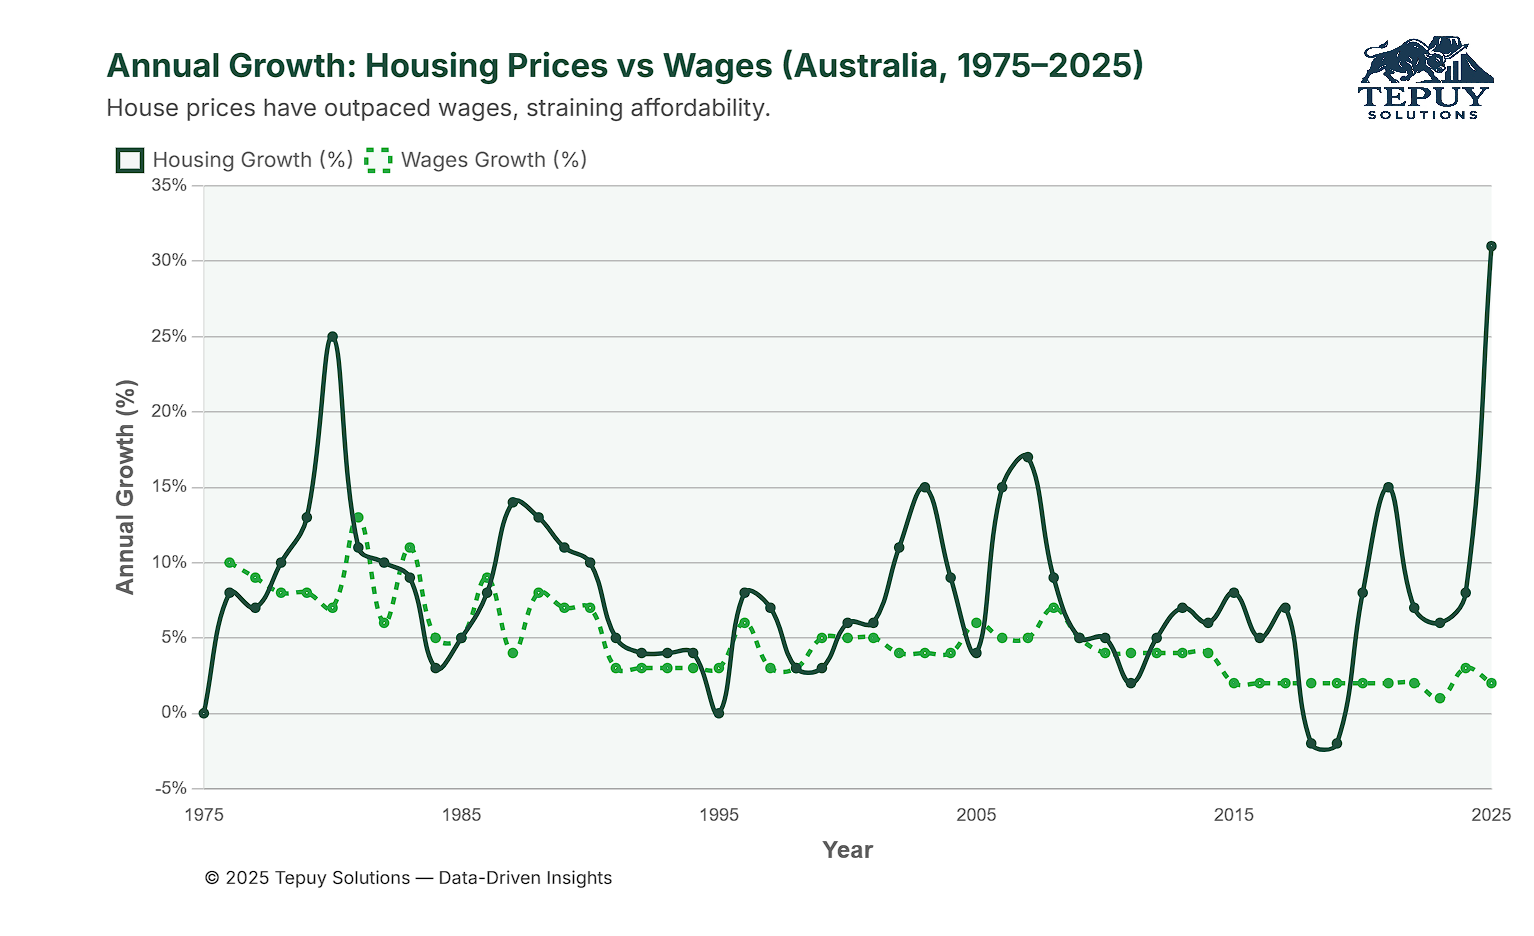
Over the past three decades, Australian housing prices have significantly outpaced wage growth. House prices have averaged an annual growth rate of approximately 6%, while wages have grown at a modest 3% per year. However, housing prices exhibit much higher volatility, with sharp spikes during boom periods (e.g., early 2000s, post-COVID recovery) and occasional corrections.
Key Insight: The growing gap between housing prices and wages has strained affordability, particularly for younger Australians...
2. Long-Term Indexed Growth from 1975–2025
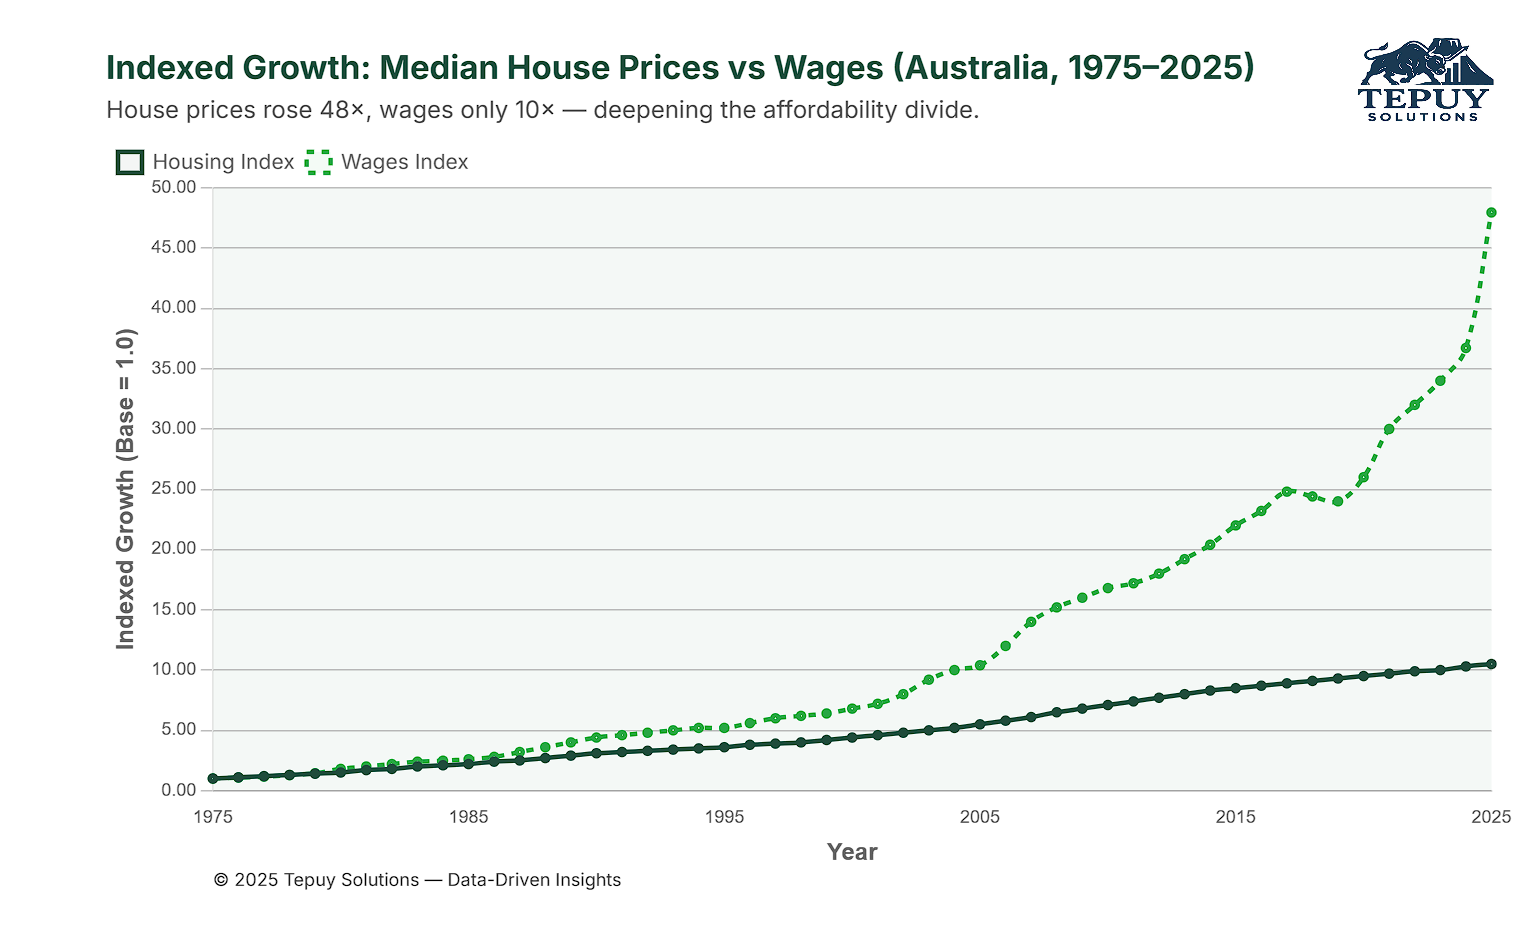
Taking a broader view from 1975, house prices have skyrocketed nearly 48-fold, while wages have only increased around 10-fold. This indexed comparison reinforces how housing has consistently outpaced income growth over nearly five decades. The chart below visualises this divergence and provides historical context for the affordability debate today.
3. Interest Rates and Housing Price Growth (1975–2024)
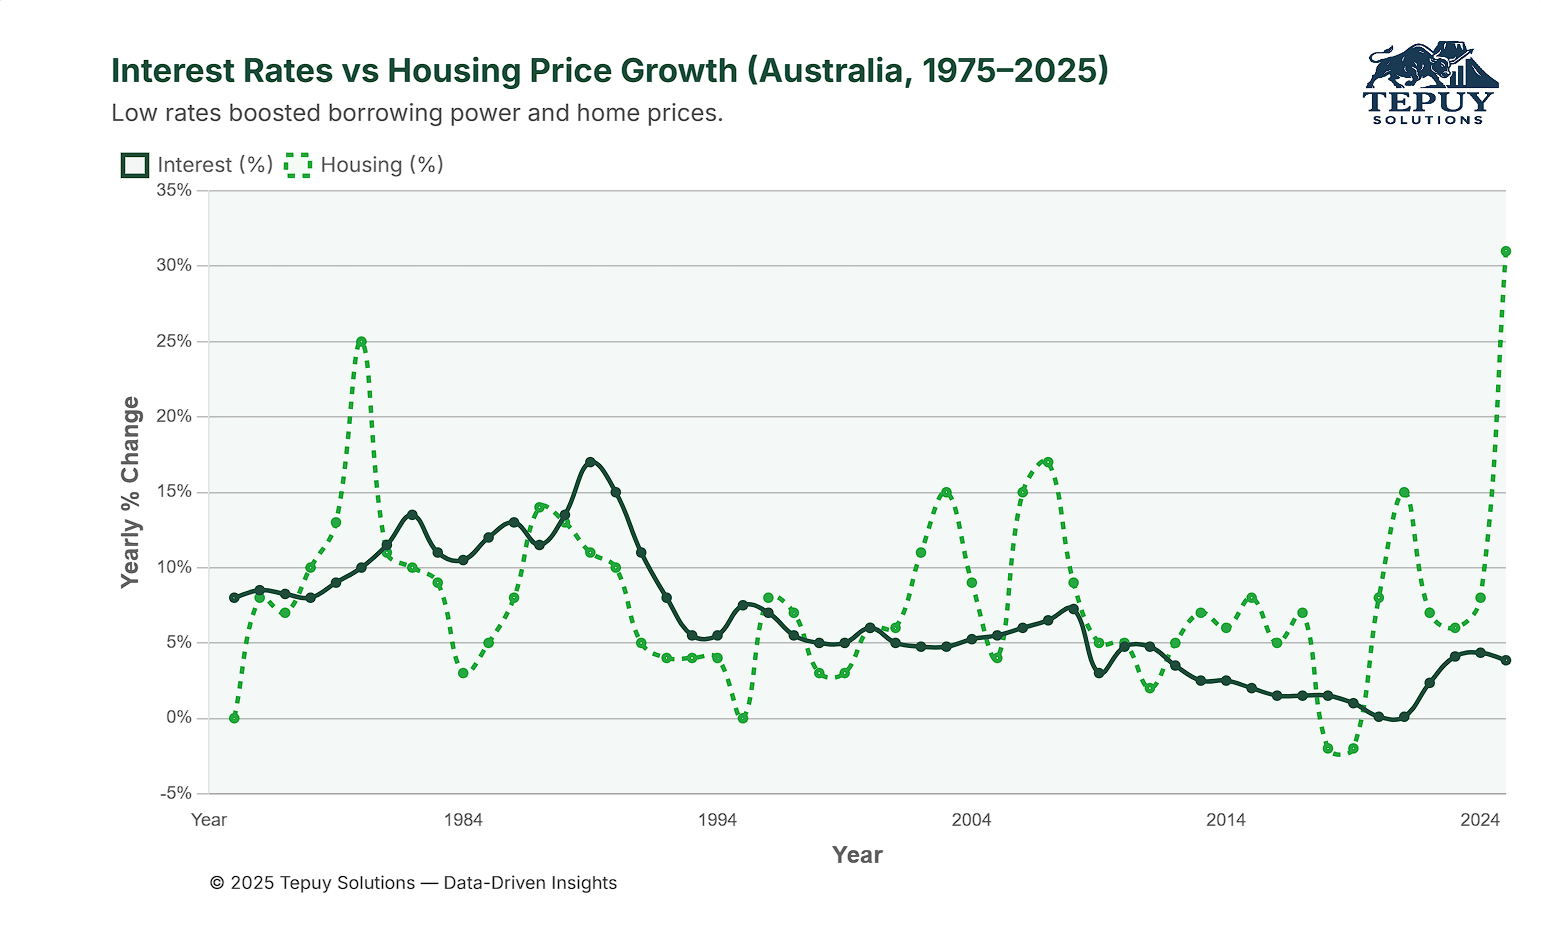
Low interest rates have been a critical driver of Australian property price growth. From 2000 to 2024, periods of declining RBA cash rates (e.g., post-GFC and post-COVID) coincided with surges in housing prices. Cheap credit increased borrowing capacity, enabling buyers to bid up prices without corresponding income growth.
Key Insight: While low rates have boosted affordability through higher borrowing power, they’ve also fueled price inflation, making it harder for first-time buyers to enter the market without significant debt. Although the RBA began raising interest rates in 2022, the impact on property prices was delayed, with growth remaining resilient throughout 2023 and 2024. However, the effects of higher rates are expected to translate into a broader market slowdown during 2025.
4. Net Migration and Housing Supply (1975–2024)
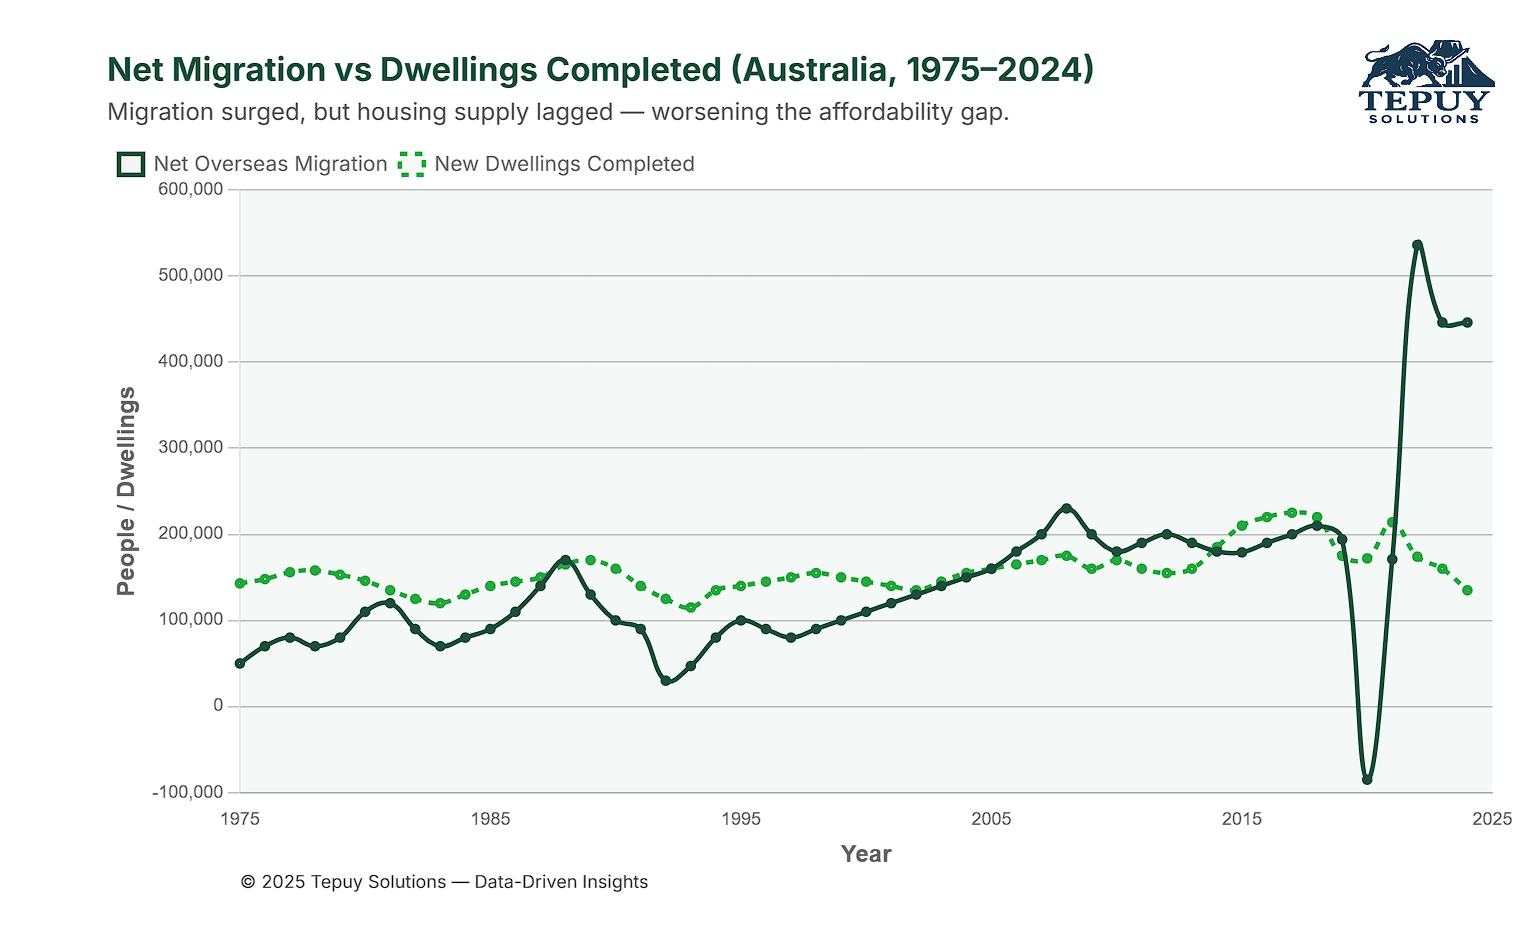
Australia’s population growth, driven by net migration, began significantly outpacing dwelling completions around 2006, marking the start of a long-term imbalance between demand and housing supply. Although housing construction briefly caught up between 2015 and 2018, the trend reversed sharply in recent years. From 2022 to 2024, net overseas migration surged to record highs, while dwelling completions declined—widening the supply gap dramatically. This divergence has been most pronounced in major urban centres, contributing to sustained pressure on housing affordability.
Key Insight: Migration-driven population growth has become a structural driver of housing demand in Australia. However, the failure to match this with adequate housing supply—especially in recent years—has intensified affordability challenges. Effective policy must address not only immigration levels but also the urgent need to boost infrastructure and housing development to restore balance.
5. Comparing Property and Shares (AUD)
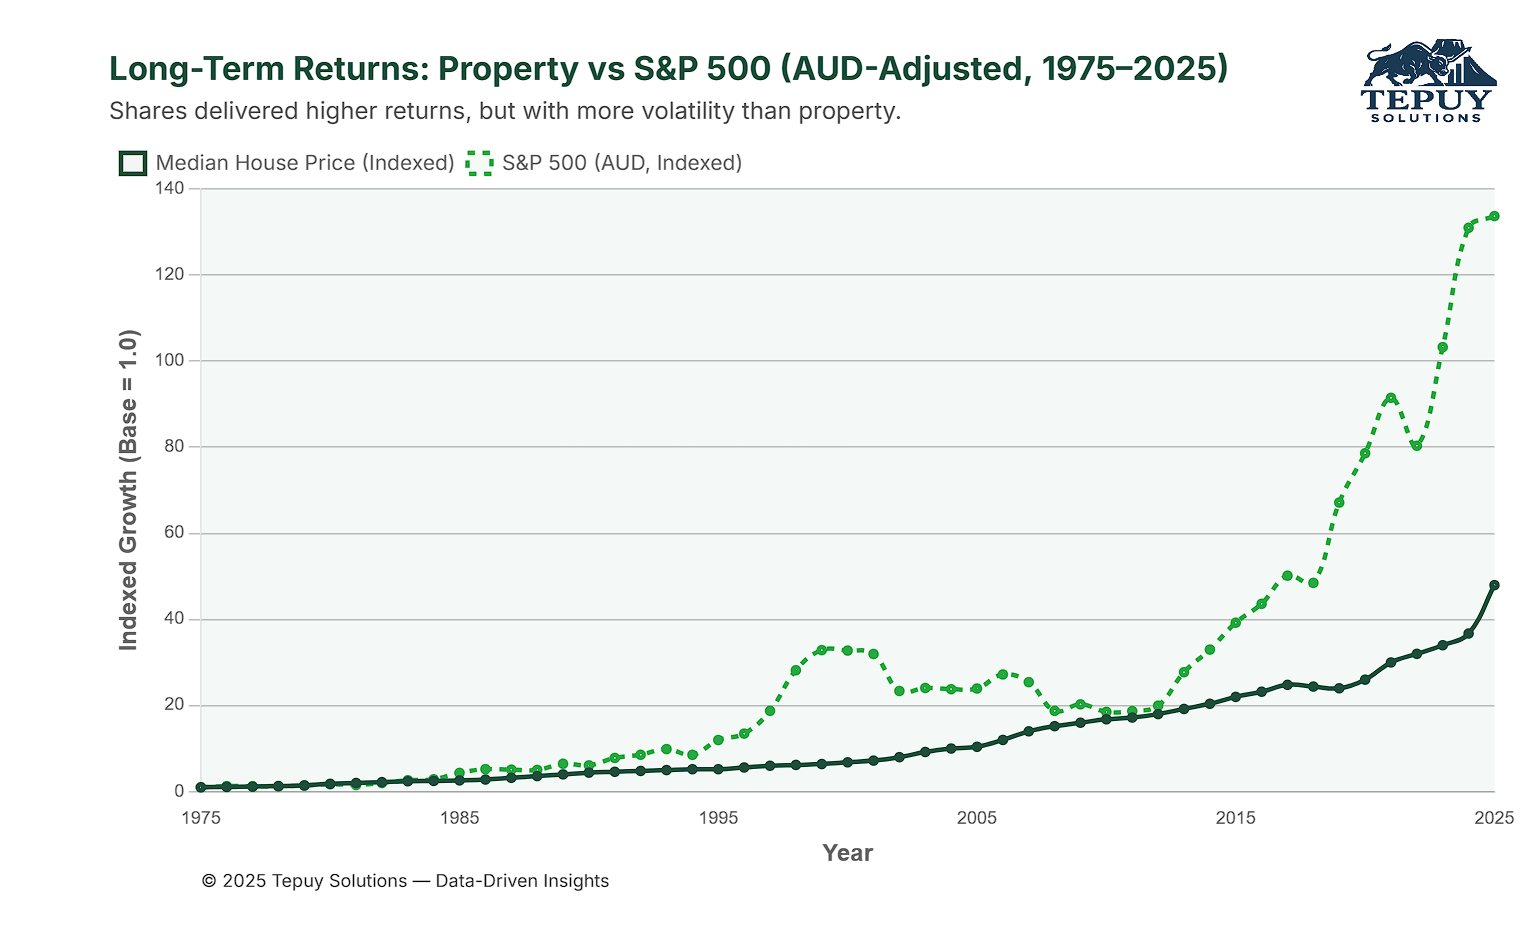
When adjusted to Australian dollars, the S&P 500 has delivered stronger total returns than Australian property over the 50-year period, averaging around 10% annually compared to property’s 6%. However, the S&P 500 comes with higher volatility, experiencing larger drawdowns during market crashes (e.g., 2008 GFC, 2020 COVID crash). Property, by contrast, has shown more stability but with lower liquidity and higher transaction costs.
Key Insight: The S&P 500 offers higher returns for investors comfortable with market swings, while Australian property provides steadier growth and tangible asset ownership, appealing to risk-averse investors. Currency fluctuations also impact S&P 500 returns for Australian investors, adding another layer of risk.
6. Inflation Trends and Investment Context
Understanding long-term inflation helps explain the purchasing power erosion that drives interest in real assets like property and equities:
- 1970s–1980s: Inflation peaked (~15%) during global shocks and policy shifts, gradually easing in the late 1980s.
- 1990s–2000s: A period of “Goldilocks” inflation with rates mostly between 1–5%, reflecting stable monetary policy and economic growth.
- 2010s: CPI remained subdued (1–3%), punctuated by a rare dip to 0.85% in 2020.
- Post-COVID years: Inflation climbed sharply—peaking at ~6.6% in 2022—before declining toward RBA targets (~3.2% in 2024, then ~2.4% in Q1 2025).
Conclusion: Which Is the Better Investment?
The choice between Australian property and the S&P 500 depends on your financial goals, risk tolerance, and investment horizon:
- Australian Property: Ideal for those seeking stability, tangible assets, and long-term growth, but it requires significant capital and is sensitive to interest rate changes and migration trends.
- S&P 500: Suited for investors prioritizing higher returns and liquidity, who can tolerate market volatility and currency risk.
Both asset classes have strengths and weaknesses. Diversifying across property and equities may offer the best balance for long-term wealth creation. For deeper insights or tailored investment strategies, consult a financial advisor or explore data-driven tools from providers like Tepuy Solutions.